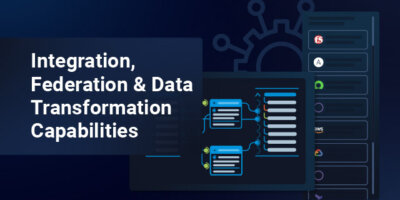


Kentik offers powerful, dynamic, intelligent network observability through its event listening capabilities. By leveraging Kentik and Itential together, you can build automations that enable you to respond to Kentik’s intelligent alerts across your network, enabling faster, more proactive remediation. This integrated solution can help organizations avoid network downtime, optimize network performance, and increase network security.
The demos below highlight a few of the use cases you easily implement by leveraging both platforms.
Empower Network Automations with Observability
This demo covers configuration of event listening and alert thresholds in Kentik, validation and security measures in Itential, and integrations with messaging systems and ITSM systems for more integrated, proactive change management.
Demo Notes
(So you can skip ahead, if you want.)
00:00 Introduction & Overview
00:58 Review AWS Blocked Traffic Use Case
01:25 Generate Alert Through Access Attempt
02:00 Review Kentik Details for Alert
02:30 Walkthrough Automation to Respond to Alert
04:00 View Event Details in MS Teams & ServiceNow
05:13 Validate AWS Changes & ConnectivityView Transcript
Mike Elrom • 00:00
Hello everyone, I’m Mike Elrom, and in today’s presentation, I’m going to show you how you can empower your network automations with network observability. Kentik is great at listening to your network’s events, and when we bolt on Itential alongside of it, we can easily respond to those events following best practices within the organization. We’ll tie into your network systems, as well as ITSM and notification platforms such as ServiceNow and Microsoft Teams. This allows us to take advantage of network events, listen to our network traffic, respond real-time before our customers tell us their issues, and simply put, be proactive. This data adds significant value when performing network automations. Users gain a sense of comfort knowing their changes have not negatively impacted their networks. Furthermore, by listening to your network through an observability platform, you can proactively automate your network, correcting thresholds before customers report issues.
Mike Elrom • 00:49
In our demo setup today, we’ve configured AWS Flow Logs to capture VPC events. We then configured Kentik to monitor the AWS Flow Logs. We’ve set up a policy inside of Kentik that if we see any events that come in for blocked web server traffic, to trigger a call into Itential’s API. Itential will acknowledge the event and then decide how to respond. We set up our automation for a few different scenarios. We might determine that we need to automatically update the ingress traffic for the security group allowing access to the web server, or we might decide that this traffic isn’t warranted and we should not permit it. Let’s take a deeper look into our setup.
Mike Elrom • 01:25
First, I’ll start with the web server. As you can see, I’m getting this site can’t be reached. My failed attempts have just generated traffic into AWS, which will be recorded by the Flow Logs. Here, we can see the public IP that my traffic is originating from. Next, inside of AWS, you can see my security group does not have any ingress rules, let alone my public IP. However, here, inside the VPC, we can see the flow logs have been configured to record traffic events. Now, inside of Kentik, we can see a map that’s been created based on the flow log data.
Mike Elrom • 01:59
It’s neatly presented the flow log data, so it’s easy to visualize. Furthermore, we can see a list of the denied traffic, and it’s easy to dig into it and identify some of the associated AWS components. Now, here is the policy that sends the information to Itential when the threshold’s been triggered. Inside of Itential’s Operations Manager, we can see the trigger that’s been configured. When Kentik reaches out to Itential for the alert, it’ll come here, which will create an Itential job against the AWS block traffic event workflow. Now, on to the automation. Our event will be digested here, where the automation will first, using our transformation task, transform the data from the event into the payloads needed for our ServiceNow, AWS, and MS Teams integrations.
Mike Elrom • 02:46
Then we’ll validate the source IP is in our allowed list. If not, we reject the event altogether. Before making any network changes, we’ve added an intentional pre-build to create a ServiceNow change request. Then we inspect our security group and determine if our source IP is missing from the ingress rules. If we found the security group was not the problem, we open a ServiceNow incident and report the results via Microsoft Teams. However, if we determine the security group was the problem, we move forward with an authorized security group ingress call and update our change request before messaging back on Microsoft Teams that we’ve completed the intentional job. Now, this is the workflow that we’ll be using and executing for our demonstration.
Mike Elrom • 03:30
But if we wanted to change any of these steps, it’s as easy as opening up this task palette and dragging a new task onto the canvas. I’m going to grab this Kentik get device call, and I’ll just go ahead and insert it at the very end here. Double-clicking the task opens it up, and without writing a single line of code, I leverage the Kentik API to get information about a particular device. Now that we know how the automation will proceed, let’s hop over to Microsoft Teams and see if we have any events. As you can see, during our setup, it’s already processed to fixed. Here in the Teams notification, we can see important information about the event and the source IP address that it’s authorized. We’ve also got links here for the Kentik dashboard, alarm, Itential job, and service now change.
Mike Elrom • 04:17
This integration into MS Teams was easily accomplished using our Microsoft Teams prebuilt for sending notifications. I’ll click into the intentional job where I can see the audit data for the automation. Looking at the green checks on the corner of each task, we can see the path the job took. As expected, since this has been approved and ingress traffic for my IP has been authorized, it took the AWS security group route. Clicking the start task, I can see the data that was sent from the Kentik event. When I click into the AWS security group task, I can see the payload we sent to AWS and the response we received back. Now even better, this automation has leveraged some other intentional prebuilds such as our service now creating update change requests.
Mike Elrom • 05:00
So now I can have intentional run in the background while it updates my network and keeps my change process up to date for me. Inside of service now, we can see the change request notes that have been updated with the critical items for my automation. I’ll click back into the web server that was blocked at the start of this demo, and now after the proactive automation, we can see that I can reach the web server. Also, back inside of AWS, we can see the security group now includes my IP address for ingress HTTP traffic. Thanks for watching this demonstration of how Kentik and Itential can harmoniously orchestrate your network.
Onboarding Devices for Network Observability
Demo Notes
(So you can skip ahead, if you want.)
00:00 Introduction & Use Case Overview
01:30 Run & Review Automation for Device Onboarding
02:30 Validate NetBox & Kentik Inventory
03:30 Update Device Configuration & Test
04:58 Review Automation Status in MS TeamView Transcript
Mike Elrom • 00:00
Hi, I’m Mike Elrom with Itential. I’m going to show you how we can onboard a device into Kentik so you can have network observability on that particular device. We’ve got a lab set up. In this particular lab, we’ve got ServiceNow, Microsoft Teams, Kentik, NetBox, Itential, and an iOS device. What we want to do is we want to get that particular iOS device that’s out there. It’s inside NetBox inventory, but it hasn’t quite gotten into the Kentik inventory yet. So what can we do? Well, we can start an automation with Itential that’ll go query NetBox and pull in the device information. We’ll then onboard the device into Kentik using an Itential pre-built.
Mike Elrom • 00:37
We’ll then go back to NetBox and update its device inventory with the Kentik asset ID. At that point, we’re done. We’ve onboarded the device, but we do want to confirm and make sure that things are working. So what do we do next? We’ll actually run some traffic on that particular device and make sure that the flow data from the device is able to reach Kentik. So we’ve applied the configuration, we’ll generate some traffic, and then we’ll validate through Kentik that Kentik has seen the flow traffic. At that point, we’ll send a Microsoft Teams notification letting everyone know that the automation is done.
Mike Elrom • 01:08
But throughout the entire process, we’ll go ahead and create and update the change request notes. So inside of Kentik, we can see that there’s not a device yet named AtlantisSwitch01. We’ve just got one test device in our inventory and no flow has been detected. What we’ll be doing is adding an additional device in here through our automation example and we’ll see some flow traffic here. So what I’m going to do first is pop into Itential. I’m going to go ahead and click on device onboarding. This is the automation that we’ve set here.
Mike Elrom • 01:36
This can be triggered from anywhere northbound through either an API, you can schedule automations, etc. Today, we’re just going to run a manual trigger from Itential’s catalog. I’m just going to pass in a switch name that I want to grab details on. So we’ll hit run there and that’ll actually start the automation. So we can see, as I zoom into this, that the automation started, it’s grabbed some of the data elements, it’s transformed some data inside of this first set, and then what we’re doing is we’re actually creating a change request here. This is another ITENTIAL pre-built, this one focuses on a change request. You can pop into these pre-builts by just clicking open, and you can see the steps being taken.
Mike Elrom • 02:18
And of course, you can click on any of these and see the incoming and outgoing data. ITENTIAL is known for their strong audit capabilities, and we can see that here as we click into each one. As I go back up into the main workflow here, after we’ve created the change request, we went into NetBox and we pulled the device information. So from NetBox, we grabbed the switch information, and we grabbed some of the other configuration details. That’s used inside of our automation, where later we send a message over Teams saying, hey, we’re going to start this automation. We’ve received a request, and we need to go ahead and process this and onboard the device. Over here is where we use our Kentik prebuilt. This particular one focuses on just merely adding that device into Kentik’s inventory, so I can pop back into Kentik, hit refresh on this page, and you can see the Atlantis switch here.
Mike Elrom • 03:10
It’s actually already detected flow traffic, so I’m assuming our automation has gone a little faster than I can do this recording and speak to you guys, but that’s good news. So Kentik has seen the flow traffic. So let’s pop back into our automation over here. The next major step here, as I said earlier on the slides, we grab the information out of Kentik, we grab the device ID, and we send that back into NetBox with this adapter call here from our prebuilt adapter into NetBox. Then we go ahead and we grab some of the configuration information from Kentik, so we’re able to know where we need to send the flow traffic. We transform some of that data using that potential transformation just to set up the payloads needed for the following steps. We run a provisioning step over here. This prebuilt focuses on sending configuration using a template into our iOS device, and this just configures the flow traffic export log so it can get into, so it can leave the device and go over to Kentik. In order for us to test this, we’ve got a test flow set up. This one leverages another prebuilt that we’ve got from Kentik. I’ll just zoom in here so you can see it.
Mike Elrom • 04:18
I click on open. This one is just us generating the traffic, grabbing some timestamps so we know that we’re looking for traffic that happened after the time that we generated the traffic. This step here is the Kentik prebuilt. It’s a device flow test, and this one focuses on locating the device in Kentik’s inventory, checking if there’s flow data, and letting us know, just ensuring from a time perspective that flow data is actually after we started generating traffic and making sure that’s a valid test. So coming back up to this top level one at the very end here, after the flow test passed, we sent a final notice into Microsoft Teams to let us know everything’s been completed. So I’ll pop into Microsoft Teams here, got a channel set up for device onboarding. Inside of here, we can see that there’s been a record here.
Mike Elrom • 05:05
Device onboarding’s begun. That was at the start of our automation. And within just a minute, it ran the automation, generated the traffic, and validated in Kentik that we’ve seen our flow trafficked. Thanks for watching as we went through our automation on onboarding a device into Kentik.